Oil & Gas Price Outlook January 2017
2016 Price Review and Looking Forward to 2017
As is popular this time of year, we wanted to do a quick review of the range of prices suggested by the strip price and the options markets as of the beginning of last year (2016). – Oil & Gas Price Outlook January 2017.
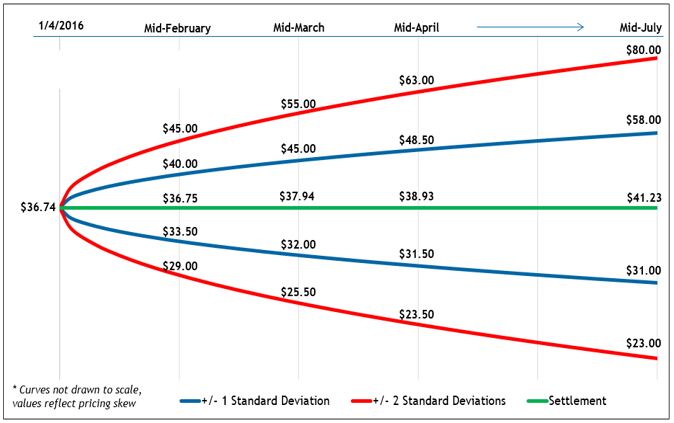
At the time (January 2016), the forecast oil strip price for year-end 2017 was approximately $43 per barrel and the one standard deviation range around that price was about $30 – $60 per barrel. As of today, the price of oil is about $53 per barrel.
The price forecast chart from one year ago:
Put differently, although one could argue that the forecast strip price was approximately 20% too low, the price today is solidly within the one standard deviation range, or within the 68% probability-weighted range. Making investment decisions based on this range and understanding the effects of both suggested price outcomes would have served an investor well last year.
In a recent equity research report, Credit Suisse sees 2017 as entering a Renaissance,1 claiming that after three years, the downturn looks closer to its end. The report notes that OPEC is cutting production to bring the rebalance of oil markets forward, the global economy has shrugged off its late 2015 weakness, and risk appetite is back in normal territory. As shale players get back to work, investors will need to watch how much production can come back for a given level of oil price. Broadly, Credit Suisse’s analysts remain comfortable with a “new normal” for oil prices at the $60’s per BBL level. Below, we consider what market participants believe future commodity prices will be, given future strip prices and option clearing prices.
Crude Oil Outlook
While futures markets aren’t a crystal ball, their price levels, and related options are useful for estimating future ranges or “confidence intervals” for crude oil and natural gas prices.
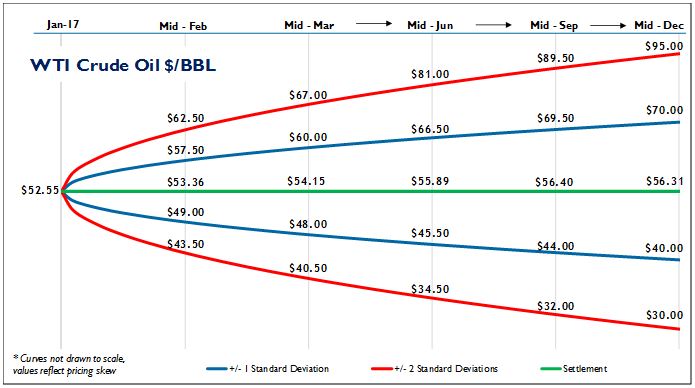
The graphic below shows the crude oil price on January 17, 2017, and predicted crude oil prices based on options on oil futures contracts (ticker /CL). The blue lines are within one standard deviation (σ) of the settlement price (green line) and the red lines are within two standard deviations for each month (for a refresher on standard deviations, see the January 2016 blog).

Based on the January 17, 2017 prices, the markets indicate that in mid-March 2017, there is about a 68% chance that oil prices will be between $48 and $60 per barrel. Likewise, there is about a 95% chance that prices will be between $40.50 and $67. For a longer-term view, by mid-December 2017, the +/- 1σ price range is $40 to $70 per barrel, with an expected value of $56.31.
Natural Gas Outlook
We can do the same thing for natural gas futures, currently trading at $3.40 per MMBTU on the Henry Hub (ticker /NG). Although more affected by seasonal factors than crude oil, in March 2017, the +/- 1σ price range is $2.85 to $4.15 per MMBTU and the 2σ range (95%) is $2.35 to $5.15 per MMBTU. The expected value of natural gas prices in mid-March 2017 is $3.40 per MMBTU.
1 – Credit Suisse, December 19, 2016 – Global Equity Research, Energy in 2017
Tags: Oil & Gas Price Outlook January 2017, Oil Price Outlook Jan 2017, Natural Gas Outlook Jan 2017
For more information, contact:
Andrew Avalos
SENIOR ASSOCIATE – ENERGY PRACTICE
If you liked this blog you may enjoy reading some of our other blogs here.
