Backward Days Are Here Again
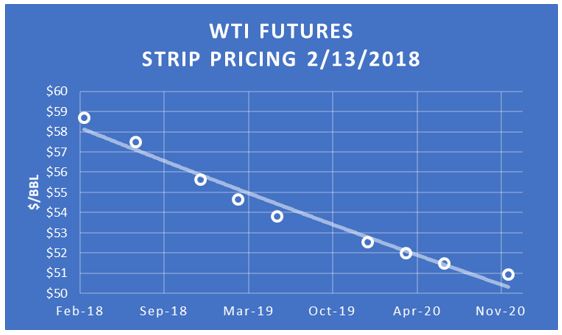
After Q4-2017’s run up in oil prices, the futures market pricing is now in a state of “backwardation.” Beginning around November 2017, the WTI calendar spread for the next six months moved from “contango” into “backwardation.” According to Reuters’ data, oil prices have not been shown “backwardation” since November 20, 2014. 1
Oil futures contracts are financial instruments that carry legally binding obligations — so a buyer and a seller have the obligation to take or make delivery of an underlying instrument, such as oil, at a specified settlement date in the future.
A calendar spread measures the difference in price between any pair of futures contracts (WTI Oil) with different delivery dates and provides insight to the current supply-demand balance in the market.
In the current case, concerns over future supply are the primary driver since demand forecasts are relatively steady. The International Energy Agency (“IEA”) recently predicted U.S. production would overtake Saudi Arabia and Russia as the world’s leading energy producer by 2019.
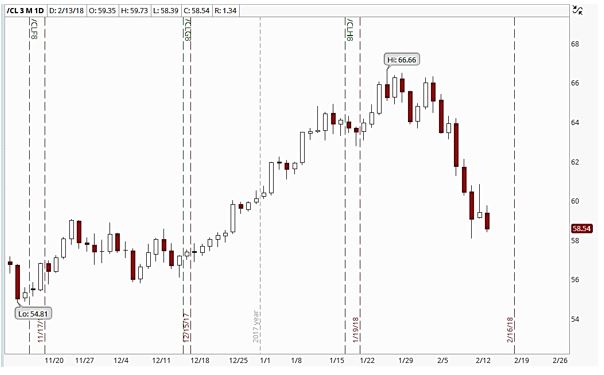
News of the growth in shale production has been aided to drive down spot prices from a high of $66.66 in late January to their current levels.
As shown above, the futures markets currently expect future supplies to lower oil clearing prices in the future.
Natural gas futures prices are not showing the same expected reductions; however, they are remaining essentially flat.
Crude Oil Outlook
While futures markets aren’t a crystal ball, their price levels and related options are useful for estimating future ranges, or “confidence intervals,” for crude oil and natural gas prices.
The graphic below shows crude oil price as of February 15, 2018 and predicted crude oil prices based on options on oil futures contracts (ticker /CL).
On the graphic below, the blue lines are within one standard deviation (σ) of the settlement price (green line) and the red lines are within two standard deviations for each month (for a refresher on standard deviations, see the January 2016 blog).
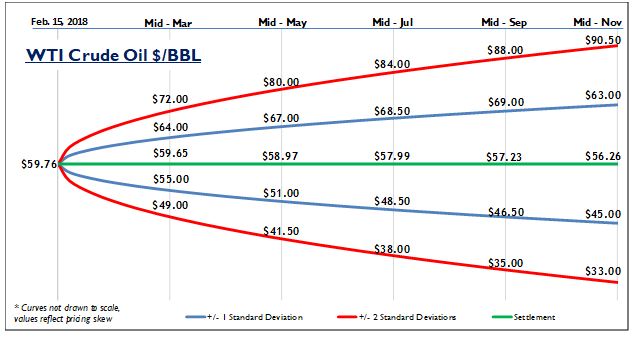
Based on February 15, 2018 pricing, the futures markets indicate that in mid-May 2018 the expected price is $58.97 with a 68% chance that oil prices will be between $51.00 and $67.00 per barrel. Likewise, there is about a 95% chance that prices will be between $41.50 and $80.00. For a longer-term view, by mid-November 2018 the +/- one standard deviation price range is between $45.00 to $63.00 per barrel with an expected value of $56.26.
Natural Gas Outlook
We can do the same thing for natural gas futures, currently trading at $2.57 per MMBtu on the Henry Hub (ticker /NG). Although more affected by seasonal factors than crude oil, in April 2018, the expected price is $2.61 with a +/- 1σ price range of $2.35 to $2.95 per MMBtu, and the 2σ range (95%) of $2.05 to $3.45 per MMBtu. For a longer-term view, by mid-July 2018 the expected price is $2.72 per MMBtu with a +/- one standard deviation price range is between $2.25 to $3.25 per MMBtu.
1. CNBC: “The oil market just did something it hasn’t done for nearly three years,”
Tags: Oil & Gas Price Outlook February 2018, Gas Price Outlook February 2018, Oil Price Outlook February 2018
For more information, contact:
Brad R. Currey, CEIV, CFA
DIRECTOR – ENERGY PRACTICE LEADER
If you liked this blog you may enjoy reading some of our other blogs here.