WTI and Brent Crude Oil’s Prices Continue to Diverge
Over the last week, WTI oil prices have increased between $2.00 and $3.00 per barrel and Brent Crude prices have increased by $3.00 to $4.00 per barrel. The increase in the Brent (North Sea) oil prices was in part due to a supply disruption in the North Sea, expected to trigger further reductions in global oil inventories.1 Around 450,000 barrels a day of North Sea output is shut off for the coming couple of weeks due to a leak in the Forties Pipeline System.2
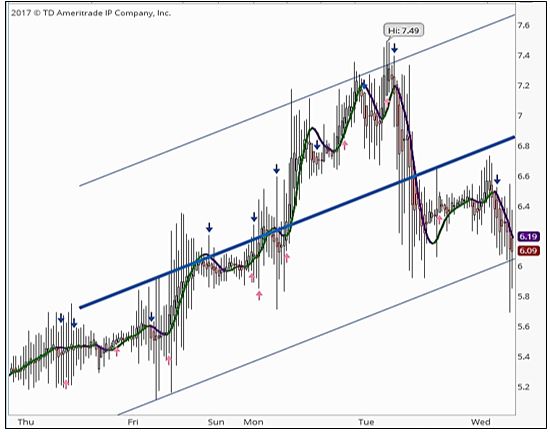
The North Sea issue exacerbated the already historically wide spread between Brent and WTI as U.S. oil prices are being kept in check by rising shale production. Over the last year, Brent has typically been priced about $3.00 per barrel more than WTI prices. The pricing differential is now approximately $6.00 per share (with a peak of $7.49 per barrel) on Tuesday.
Brent Oil Prices Less WTI Prices Per Barrel (Last Week)
OPEC’s production level fell to its lowest in six months while U.S. production was surging faster than expected, meaning oil markets may not rebalance before the end of 2018, the oil cartel said Wednesday in its closely watched monthly oil report. However, the main driver in non-OPEC output comes from the U.S., where production is expected to grow 1.05 million barrels a day in 2018.3
Crude Oil Outlook
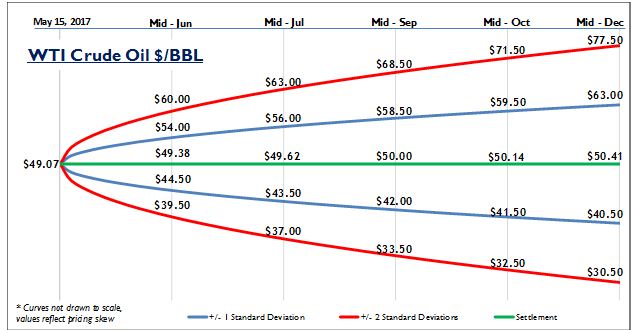
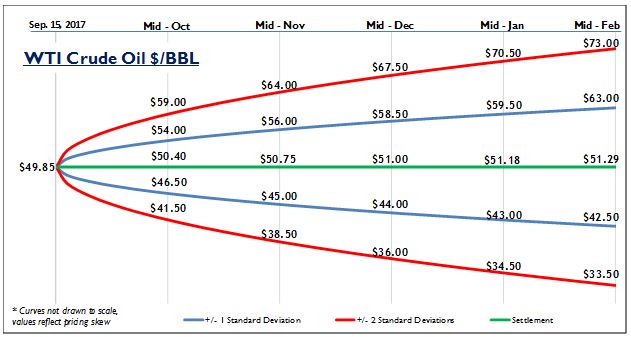
While futures markets aren’t a crystal ball, their price levels and related options are useful for estimating future ranges, or “confidence intervals,” for crude oil and natural gas prices.
The graphic below shows crude oil price as of December 15, 2017 and predicted crude oil prices based on options on oil futures contracts (ticker /CL).
On the graphic below, the blue lines are within one standard deviation (σ) of the settlement price (green line) and the red lines are within two standard deviations for each month (for a refresher on standard deviations, see the January 2016 blog).

Based on December 15, 2017 pricing, the futures markets indicate that in mid-February 2018 the expected price is $57.23 with a 68% chance that oil prices will be between $52.00 and $62.00 per barrel. Likewise, there is about a 95% chance that prices will be between $46.00 and $69.50. For a longer-term view, by mid-May 2018 the +/- one standard deviation price range is between $48.50 to $63.00 per barrel with an expected value of $56.83.
Natural Gas Outlook
We can do the same thing for natural gas futures, currently trading at $2.71 per MMBtu on the Henry Hub (ticker /NG). Although more affected by seasonal factors than crude oil, in February 2018, the expected price is $2.72 with a +/- 1σ price range of $2.25 to $3.35 per MMBtu, and the 2σ range (95%) of $1.85 to $4.75 per MMBtu. For a longer-term view, by mid-May 2018 the expected price is $2.65 per MMBtu with a +/- one standard deviation price range is between $2.25 to $3.15 per MMBtu.
1. Sarah McFarlane, Wall Street Journal, Dow Jones Newswires 12-13-17 0658ET, Copyright (c) 2017 Dow Jones & Company, Inc.
2. Ibid.
3. Benoit Faucon, Wall Street Journal, Dow Jones Newswires 12-13-17 0720ET, Copyright (c) 2017 Dow Jones & Company, Inc.
Tags: Oil & Gas Price Outlook December 2017, Gas Price Outlook December 2017, Oil Price Outlook December 2017
For more information, contact:
Brad R. Currey, CEIV, CFA
DIRECTOR – ENERGY PRACTICE LEADER
If you liked this blog you may enjoy reading some of our other blogs here.


 Iran’s Islamic Revolutionary Guards Corps blamed both Saudi Arabia and the United States for the assaults. At the same time, a Sunni extremist group called the Islamic State took credit for the terrorist attacks.