In financial markets, infrequent or rare events are referred to as “Black Swan” events. The term “Black Swan” was popularized by Nassim Nicholas Taleb in his 2007 book, The Black Swan: The Impact of the Highly Improbable. Taleb describes Black Swan events as possessing three key attributes:
- Extremely rare
- Severe impact
- Obvious in hindsight
Such events can have fundamental causes such as the 2008 market decline and recession or simply can be the result of herd events where people rush to reset expectations. Regardless of the cause, the US stock market and securities markets in general have proven to be surprisingly resilient since World War II.
The chart below depicts the S&P 500’s value from September 12, 2008 (the trading day before Lehman Brothers declared bankruptcy) through December 21, 2010. On September 12, 2008, the index closed at 1251.70. Over the following six months, the S&P 500 fell 46.0% to 676.53. The market recovered over the following 21 months, reaching 1254.60 on December 21, 2010.

Similar to the 2008 crash, the coronavirus, or Covid-19, typifies a Black Swan event. Due to the high incidence of severe cases and lack of sufficient hospital and emergency facilities to handle the pandemic if left unchecked, suppression strategies to slow the spread and peak number of cases requiring hospitalization are being adopted [1]. These suppressions strategies include:
- Self-quarantine for persons exposed to persons with the virus;
- Closing schools for periods of time;
- Limiting the size of group meetings;
- Restricting or closing many retail businesses;
- Limiting food service to drive-through or take-out;
- Limiting travel (banning some international destinations and persons originating from certain places) and screening passengers departing and arriving on planes and ships
- Banning unnecessary travel outside the US (e.g., to parts of Italy and China).
Obviously, such suppression strategies will have economic consequences that will suppress or depress economic activity in many business sectors but could reward others. Additionally, the greater the uncertainty as to how long, how severe, and how permanent the damage, the greater will be the valuation consequences.
The following chart provides a comparison of the stock market during the 2008 crash following the Lehman Brothers bankruptcy and the Covid-19 crash that we are currently experiencing. We have indexed the starting values to 100 to provide a better comparison. March 17, 2020 was the 19th trading day of the Covid-19 crash. Since the high of 3386.15 on February 19, 2020, the market has declined 25.3% to close at 2529.19 on March 17th.

As shown in the chart above, the trajectory of the Covid-19 crash is similar to that of the 2008 crash. By day 19 of the 2008 crash, the market had lost 27.3%, declining from 1251.70 to 909.92. The key question is: How will Covid-19 actual impact valuations moving forward? This paper seeks to provide a framework for answering that question.
Market Valuation: The Two Key Factors
Fundamentally, all valuations should be based on two factors: 1) expectations of the amount and timing of future cash flows and 2) the perceived “systematic” risks associated with such cash flows. It follows then that changes in valuations result from changes in these two factors. John Campbell and Tuomo Vuolteenah describe the sources of market crashes as:
”The value of the market portfolio may fall because investors receive bad news about future cash flows; but it may also fall because investors increase the discount rate or cost of capital that they apply to these cash flows.” [2]
Factor 1: Expectations Regarding the Amount and Timing of Cash Flows
For most businesses, especially those in hospitality (e.g., restaurants, hotels/motels), entertainment (e.g., sporting events), and travel (e.g., airlines), there will be an extended period where business will be depressed (even without government mandates or restrictions) or entirely shut down. Some estimates project extremely depressed activity levels in the United States could be as short as mid-May or at least until August 2020. Additionally, it may be that periodic shutdowns in specific communities, regions of the world, or countries may occur until there is confidence that anti-viral regimens have proven successful in limiting and treating the illness and become more widely available, vaccines are at least safe and partially effective and more widely available, and/or the capacity of the health care facilities and systems to treat the severe cases is manageable. That may mean that we cannot expect a complete resumption of previous levels of travel and commerce in some business sectors until as late as mid-2021 but we might observe partial recoveries in at least some activities over time.
For the most adversely affected businesses, there will be questions regarding the extent of the losses and the ability to sustain them. Business which requires travel, larger groups, or social interaction are likely to suffer the greatest losses. At this point in time, at least until the next set of quarterly earnings, conference calls, and revised guidance, the extent of the losses will be uncertain even within defined periods of time, and the length of time those losses will occur will still remain highly uncertain. This explains in large part the high volatility (i.e., large fluctuations) in the US stock exchange indices over the past two weeks.
Resiliance
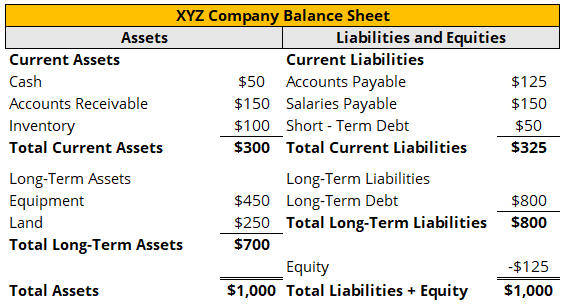
Resilience relates to the ability of businesses to withstand periods of depressed economic activity. Resilience is affected by a company’s degree of operating leverage and financial leverage. Operating leverage is affected by the fixed costs and expenses a business must incur to remain either minimally open (if remaining open but with reduced economic activity) or to prevent a loss of the value of assets or foreclosure (e.g., rents, maintenance, storage costs, minimum salaries of retained personnel). Financial leverage is a function of the amount of liquid assets (cash and investments, which reduce leverage) a business has and the amount of liabilities, especially interest-bearing debts, a business must honor, and the rate of payments required to avoid a default, foreclosure, or bankruptcy. [3]
Mitigation
Mitigation is related in part to the degree to which government subsidies or supports may be received, creditors may extend credit or defer required payments, and the extent to which the company will be able to raise additional funds, if needed, in order to avoid failure and soften the losses. Government support is likely only in key business sectors, is uncertain as to amount and types (more likely in the form of loans which will have to be repaid once the economy recovers) and will likely vary by country and business sector. US airlines, for example recently estimated losses of at least $58 billion and appear to be hopeful that at least some types of favorable loans might be provided for relief, but no specific indication exists as to the extent or type of mitigation. Many creditors of businesses suffering short-term losses or distress may be willing to defer or reduce required or past-due payment amounts on liabilities in order to prevent any otherwise viable business from being forced into bankruptcy.
Cash Flow Expectations and Valuation
To simplify the problem of valuing a common stock, it might be possible to think in terms of the cash flow from now through the end of the crisis, the price at the end of the crisis, and the probability that the business survives the crisis. In this framework, the value of a common stock would be as follows:

where:
P0 = the current price of the security
psurvive = probability that the business will survive until the end of the crisis
CF = the “cash” earnings or net cash flow per share between now and the end of the crisis
P1 = the price of the security at the end of the crisis
r = the required rate of return over the crisis period which is the function of the long-term market risk-free interest rate and risk premium required for the given stock
In an even more simple way to proceed, think of CF as the amount of dividends you expect through the end of the crisis. For many companies that do not pay dividends, the amount expected is zero. [4] Given that, the only question is determining psurvive, P1, and r.
The reason why the stock market indices are so volatile (and implied volatilities used to value stock options are so high) is because investors have different and rapidly changing views about the cash flows during the crisis, the probability of survival, the value at the end of the crisis, and the required rate of return for each company that is publicly traded and for the market as a whole. To the extent that many investors are looking at broad stock market indices and funds (ETFs or mutual funds), it is entirely likely that some common stocks will be inappropriately valued initially when panic selling occurs.
Some companies, like utilities and communications providers, may experience reduced revenues but have sufficient and sustained revenues (unless they have high debt loads) to remain minimally profitable during the interim period. In that case, we might consider even a positive but reduced level of earnings in the short term with positive cash flow during the crisis and a probability of survival that would equal 100% or close to it.
Some grocery stores and pharmacies might actually be experiencing an increase in demand and sudden surge in revenues, but investors may be substantially overestimating the long-term effects. Investors may be both overestimating the effects of cash flow increasing and implicitly assuming that the price after the crisis will increase as well when that may not be a reasonable assumption. In other words, the sudden surge in buyers in grocery stores for certain products over the weekend may simply be temporary and once the one-time fears and sudden increases in demand have been fulfilled, revenues will revert to more traditional replacement level demand or may even decline later, to the extent only necessities are purchased by customers until the economic uncertainties are resolved. This would mean that the short-term effects will be extremely modest or immaterial from a valuation standpoint.
Even when valuing a REIT (Real Estate Investment Trust), you may have to consider the extent to which certain properties derive a portion of their rents from the revenues of their larger tenants, experience increased vacancies, or have to decrease or defer rent payments from tenants until the economy recovers. In that case, you might discount the amount of dividends that a REIT will pay or be able to pay from now until, say, June 30, 2020.
The oil and gas exploration and production industries are particularly interesting. The availability of new methods of extraction and production have increased the estimated reserves available worldwide and lowered the costs. Additionally, demand is affected by economic activity and, thus, expected to be depressed at least until sometime in 2021. Finally, Russia and Saudi Arabia were unable to agree on reduced production levels, and Russia reportedly believes it can squeeze out the US producers that are heavily indebted to reduce the growth and amount of US production coming into the world market and depressing prices. In that case, many US oil and gas producers may be facing substantial losses or declines in revenues, especially due to the extent they must drill, complete, and stimulate wells to continue to sustain production and/or are more heavily indebted. Thus, for many US oil and gas producers, the probability of survival, will likely be significantly less than 100% and cash flow will certainly be negative for the company unless they own a lot of low-cost producing reserves. Dividend payments will likely be suspended and the value remaining at June 30, 2021 (P1) may be reduced.
Factor 2: “Systematic” Risk and Uncertainty
Investors will naturally discount future values for the time it takes to realize those returns and for the underlying uncertainty.
“Systematic risk”
Most investors are considering a broad portfolio of investments. They are not concerned with risks that are unique to a given company if those “company-specific” risks can be offset or can be substantially diluted by holding a diversified mix of common stocks. Instead, they care more about “systematic” risk and especially “downside” risks that occur when the decline in value coincides with market-wide stock price declines and economic downturns. For this reason, the discounts investors require do vary over time. During periods of relatively stable economic activity and growth, the discounts for “systematic” risk tend to be reduced over time. This is one reason the US stock market indices since 2010 have increased steadily and implied “risk premiums” over this period of time through say early February 2020 have generally declined. However, in the current market conditions, with the belief that the US and world economy is in or will be in a severe recession in 2020, the “risk premium” has increased and is expected to increase substantially. This means that the discount on the future value will be greater but even more importantly, sometimes investors apply the increased discount rate to the projected value of the stock and reduce the projected growth rates in the future for the economy and the business. The simple “Gordon Growth” model is as follows:
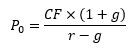
where:
P0 = the current price of the security
CF = the steady-state level of “cash” earnings or net cash flow per share
g = the projected “normal” level of growth in earnings per share
r = the required rate of return which is the function of the long-term market risk-free interest rate and risk premium required for the given stock
Given the recent stock market declines, investors appear to be assuming generally that even when the economy recovers and stabilizes, CF may be lower in the future than now on a per share basis, g may be lower than previously expected, and the risk premium is greater due to uncertainty than it has been in the past.
If, however, the economy stabilizes and recovers by June 2021, then the risk premium may revert back to normal and the stock market indices may entirely recover by June 2021 or at some point thereafter. This may create a short-term investment opportunity at some point in 2020. For example, Goldman Sachs on March 16, 2020 issued a general report indicating that it expected US stocks to potentially decline another 16% to a bottom around 2,000 on the S&P 500 Index from 2,386 at the close of trading on Monday, March 16, 2020. The all-time high was reached on February 16, 2020, at 3,394. Thus, by March 16, 2020, the S&P 500 Index (a broad US market index for common stocks) had fallen almost 30% from the high one month earlier. If Goldman Sachs is correct, we could expect as much as a 41% decline from the highs realized earlier on February 16, 2020, in the next few months.
What is interesting, however, is Goldman Sachs is also predicting that the US stock market will recover most of the losses realized in the past month by the end of 2020. Goldman Sachs projected the S&P 500 Index to be at 3,200 at year end under the scenario presented. In other words, investors by the end of 2020 will have greater clarity and less uncertainty and assume that the economy and stock prices will entirely recover. That would mean that share prices for larger US stocks would increase 26.5% from the close on Tuesday, March 17, 2020.
Most investors are not making this assumption. If they were assuming this to be true, then the S&P 500 Index would likely have recovered to at least 2,800 already. It is more likely and assumed by most investors that at least some of the damage suffered in 2020 will be sustained and some companies will not recover from the economic effects by the even end of 2021.
Uncertainty
Risks that are identifiable and understood tend to be managed and discounted in a normal and predictable manner. Uncertainties that are more general and greater than normal, on the other hand, are not well managed or “priced” by investors. Investors tend to overstate the “risks” in the face of uncertainty on average and, thus, tend to increase the risk premium in the expected return for investments more than they should and discount the longer-term average expected rate of return on such investments.
Professor Damodaran, a corporate finance and valuation professor at the Stern School of Business at New York University, maintains an estimate of the equity risk premium. [5] He estimated that the equity risk premium increased 55 basis points (0.55%) from February 1, 2020 to March 1, 2020, which only captures part of the market reaction to date. [6] In broad terms, that is more than a 10% increase in the equity risk premium in one month. Also, long-term growth rates have declined in his estimates. While approximate, this does give a good idea of the effects of uncertainty and suddenly negative news on how investors discount for risk and uncertainty. By March 17, 2020, the implied equity risk premium increased by perhaps another 70 basis points (0.70%), which means that the equity risk premium increased by about 25% in one month due to uncertainty.
Assuming the economy stabilizes and risk premiums revert to prior levels, this creates opportunities for investing against market sentiment. For example, if an investor made a bet on the S&P 500 Index at the end of October 2008 (after the Lehman Brothers collapse but well before the market had bottomed out), and reinvested all dividends through March 17, 2020, the total return would have been 232.38%, or 11.1% per annum. If an investor bet at the end of February 2009 (when the market was close to the bottom) and held until the end of January 2020 (close to the peak), then the total return would have been 450.5%, or 16.9% on an annualized basis.
Obviously, it is not possible to “time” the market so perfectly, but the lesson from this example is that investors who hold on and don’t panic often come out with reasonable returns over longer investment horizons and holding periods.
What the current stock prices in the US tell us is that investors may be over-reacting to short-term events that, assuming no systematic failures of the financial system occur, may provide unusual investment opportunities in the short-term.
On the other hand, Goldman Sachs may be too optimistic in not accounting for the dilution in share values and debts that may be required to raise capital or borrow to cover losses in the short term in order to keep companies from failing and the risks of some companies failing. At least some investors are betting on that happening. Furthermore, if the US and world economy suffers more systematic damage to the institutions and faith in those institutions, a series of more serious consequences may follow, as occurred in the 1930s during the Great Depression. The effects of the Great Depression were systematic in terms of failing financial institutions and the time required to recover. Ultimately, a world war occurred, and it required a unique set of circumstances to pull the US economy out of the depression. We highly doubt that will occur in this instance but cannot say that the risk is zero of at least some systemic damage occurring.
Conclusion
We cannot predict what will occur and recognize tremendous uncertainty exists at this time as to the ultimate economic effects of the current pandemic. But reacting and thinking logically helps to avoid panic selling into a downturn or overly enthusiastic buying in a booming market (which may have been the case by February 16, 2020).
[1] See Walsh, “US, UK coronavirus strategies shifted following UK epidemiologists’ ominous report,” CNN, March 17, 2020. Using simulation modeling, researchers estimated that “even if all patients were able to be treated, we predict there would still be in the order of 250,000 deaths in [Great Britain] and 1.1-1.2 million in the US.” Perhaps 15% of all persons infected will experience severe symptoms requiring treatment including oxygen and 5% of more will require critical treatment with ventilation, according to WHO. Mortality estimates have been as high as 1% to 4% generally and are much greater for persons above the age of 60 or with known weaknesses in immune responses or adverse circulatory or respiratory conditions)
[2] Campbell, J. Y., & Vuolteenaho, T. (2004). Bad Beta, Good Beta. The American Economic Review, 94(5), 1249–1275. Retrieved from http://www.jstor.org/stable/3592822
[3] Financial distress can impose additional costs and cause even greater losses and, if severe, can inhibit a business from recovering once economic activity recovers. See Hakala and Keath, “Analysis and Valuation of Distressed Equity Securities,” Valuation Strategies, September/October 1999, pp. 24-34. Publisher: Warren, Gorham & Lamont.
[4] Some companies will pay dividends over the interim period and possibly at a decreasing rate or amount as economic conditions deteriorate.
[5] Damodaran’s estimated equity risk premiums are updated on a monthly basis at: http://pages.stern.nyu.edu/~adamodar/.
[6] The S&P 500 index decreased by 9.07% from February 3, 2020 to February 28, 2020 and decreased by an additional 18.16% from March 2, 2020 to March 17, 2020.
For more information, contact:
Dr. Scott Hakala has extensive practical knowledge of finance, economics, statistics, and business valuation theory. His expertise includes: corporate finance, restructuring and cost of capital; the valuation of securities and business interests (transactions, mergers, acquisitions, fairness opinions); the valuation of intangible assets (patents, trademarks); analysis of publicly traded securities (insider trading studies, trading analyses, event analyses, materiality, damages in securities litigation); expert testimony and economic loss analyses (commercial litigation); wage and compensation determination (reasonable compensation studies, lost personal income, wrongful termination); transfer pricing; derivative securities (options pricing and valuation); and antitrust and industry structure, strategic pricing, marketing and cost allocation analyses.
The information presented here is not nor should it be treated as investment, financial, or tax advice and is not intended to be used to make investment decisions.
If you liked this blog you may enjoy reading some of our other blogs here.